140 UK Food and Drink Labelling Statistics (October 2026)
Updated October 2026. Every statistic on this page links to its original publisher; the few exceptions are flagged next to the figure and explained in the methodology.
A food label is a legal declaration and an allergy safety device, and one wrong word can force a recall. Across all incident types, the Food Standards Agency was notified of 2,073 food and feed safety incidents in England, Wales and Northern Ireland in 2025/26, up 14% on the year before (FSA, Jun 2026).
The people responsible for getting labels right are overwhelmingly small. There are about 25,170 food and drink manufacturing businesses in the UK, including about 13,000 unregistered sole traders, and 98.8% of them are small or medium-sized (Defra, Jul 2026). They face a growing list of labelling rules and rising wage bills, with far fewer applicants per vacancy than a decade ago.
This page collects the numbers behind that squeeze: how often labels go wrong, who gets hurt when they do, which rules are changing, why producers are automating, and the state of the industry that makes the labels. Every figure is traced to its original publisher where possible, dated and linked. We refresh it monthly.
Cite this page: Sessions UK (2026). 140 UK Food and Drink Labelling Statistics. Last updated 11 October 2026. https://sessionsuk.com/food-drink-labelling-statistics/ . Quoting a single figure? Please cite the original publisher linked beside it.
Key Takeaways
- Failed labelling verification checks were the most common root cause in the allergen incident root cause analyses submitted to the FSA in England, Wales and Northern Ireland, at 30% in 2025/26 (FSA, Jun 2026).
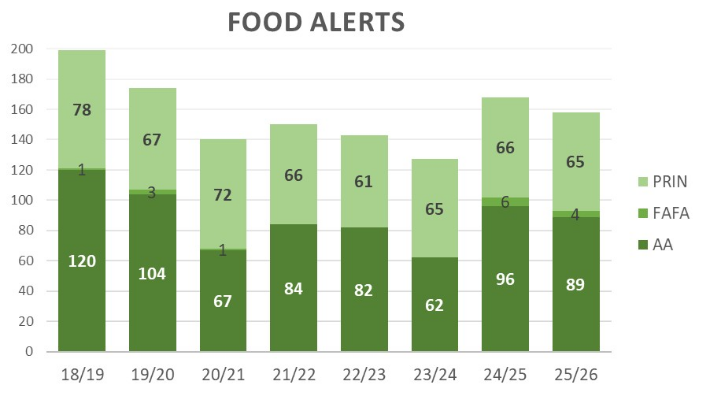
- FSA Allergy Alerts rose 55% in a single year, from 62 in 2023/24 to 96 in 2024/25, a spike the FSA put down notably to one peanut-in-mustard incident (FSA, Jun 2025).
- 24% of 621 food labels checked in the FSA's 2025 retail sampling, which targets higher-risk products, were unsatisfactory (FSA, Jul 2026).
- Allergens caused 57.6% of UK food recalls between 2016 and 2021 (Food Control, Sep 2022).
- About 6% of UK adults, around 2.4 million adults, have a clinically confirmed food allergy (FSA, May 2024).
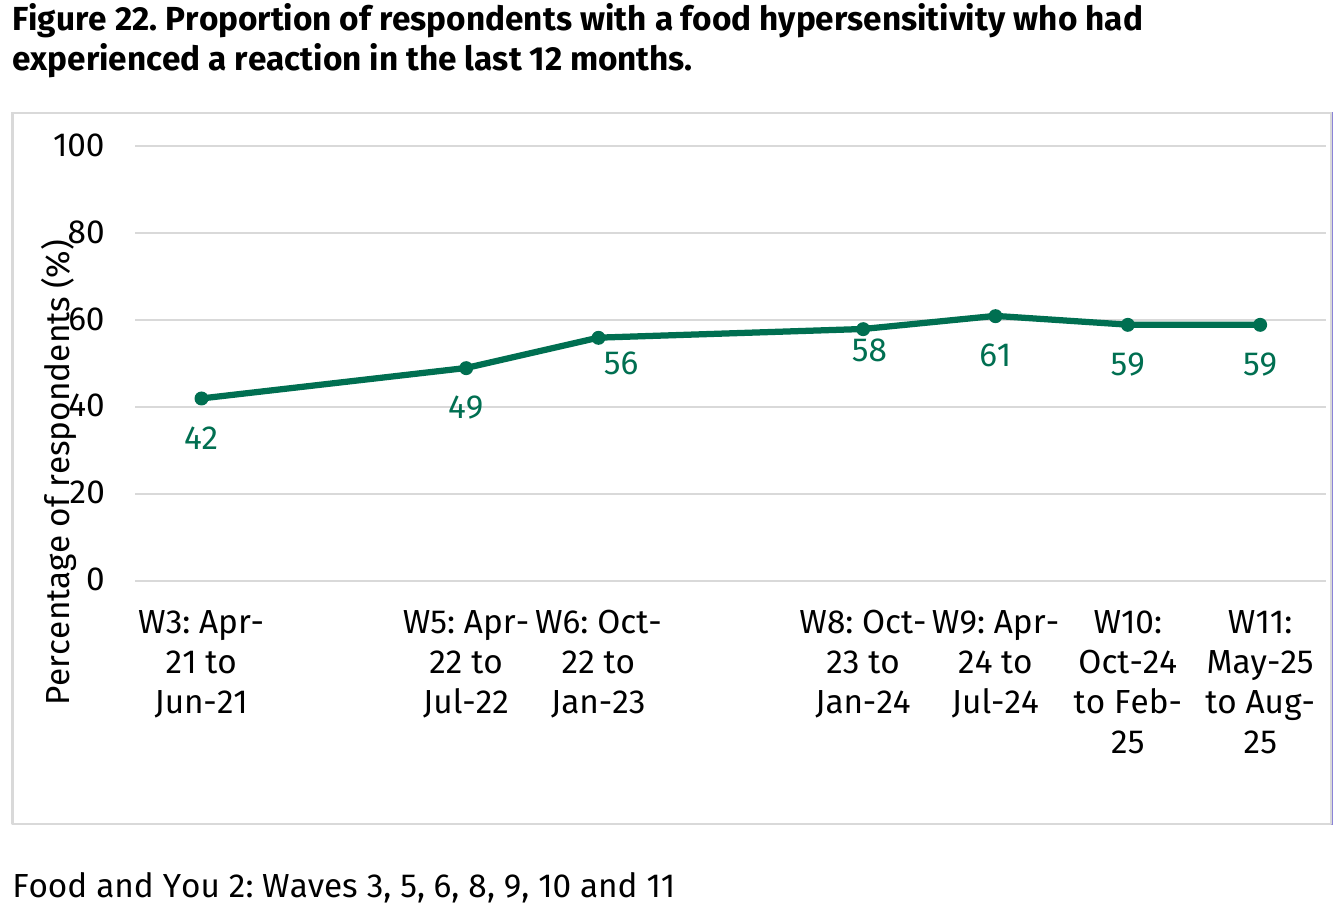
- 59% of people in England, Wales and Northern Ireland with a food hypersensitivity had a reaction in the past 12 months, up from 42% in 2021 (FSA, Mar 2026).
- Hospital admissions in England for food-induced anaphylactic shock rose from 686 in 2002-03 to 1,709 in 2023-24 (NHS England, Jan 2025).
- Relabelling drinks for the deposit return scheme is costed at an average £2,000 per SKU, and Defra puts the one-off relabelling cost for the England and Northern Ireland scheme at about £50.8 million (Defra, Nov 2024).
- 76% of businesses selling prepacked-for-direct-sale food say they fully comply with Natasha's Law, falling to 69% of businesses with 1 to 5 staff (FSA and FSS, Apr 2023).
- PackUK expects to recover £1.558 billion in packaging EPR fees from producers in 2026 to 2027 (PackUK, Aug 2026).
- 53% of food and drink manufacturers say minimum wage rises have led them to increase automation to replace labour, rising to 61% of SMEs (FDF, May 2026).
- Food and drink manufacturing ran a 4.3% vacancy rate in Q2 2026, about double the 2.0% for manufacturing as a whole (FDF, Aug 2026).
- 71% of the UK's 12,085 registered food and drink manufacturers employ fewer than 10 people (ONS, Sep 2026).
- UK manufacturers sold £816.9 million of printed self-adhesive paper labels in 2025, up 4.2% on 2024 (ONS, Jul 2026).
How often do food and drink labels go wrong?
Most labelling failures are routine, such as a missing allergen or a wrong date, and they get through when nobody checks the label against the recipe before it ships.
How many labelling and allergen incidents does the FSA handle each year?
Hundreds a year, and allergens are now the second most reported hazard. Note that the FSA changed how it records incidents in May 2025, so labelling counts before and after that date are not directly comparable.
- The FSA recorded 281 allergen incidents in 2025/26, 14% of all incidents, up from 264 in 2024/25 and 240 in 2023/24 (FSA, Jun 2026).
- Incidents logged as "labelling absent, incomplete or incorrect" rose from 105 to 190 in 2025/26, which the FSA says is mainly because its new recording system lets one incident carry several hazards (FSA, Jun 2026).
- A single peanut-in-mustard contamination in autumn 2024 triggered 3 Allergy Alerts and 31 follow-up alerts covering 59 brands and 307 products (FSA, Jun 2025).
- 12% of 205 food samples the FSA tested for specific allergens in its 2025 targeted sampling, which focuses on higher-risk products, contained an allergen not declared on the label (FSA, Jul 2026).
- In Scotland's 2024/25 sampling of prepacked-for-direct-sale food, all 10 failures were labelling problems: wording errors, missing labels or misused "may contain" statements (FSS, May 2026).
What causes allergen and labelling errors on food packs?
Process gaps, mostly. The ingredient was in the recipe, but it never made it onto the label, or the right label went onto the wrong product.
- Labelling issues, mainly missing information and incorrect use-by dates, made up 34% of the "other" incident root cause analyses the FSA received in 2025/26, which exclude allergen, microbiological and foreign-body cases (FSA, Jun 2026).
- The most common reason for UK allergen recalls from 2016 to 2021 was leaving a priority allergen out of the ingredients list, at 40.0% of allergen recalls (Food Control, Sep 2022).
- In Australia, packaging errors such as putting product into the wrong pack were the most common root cause of undeclared-allergen recalls from 2021 to 2025 (FSANZ, Apr 2026).
- A customer complaint was the most common trigger for Australian allergen recalls: 91 of 197 undeclared-allergen recalls (46%) from 2021 to 2025 began with one, against 28 found by routine company testing (FSANZ, Apr 2026).
How does the UK compare internationally, and what does a recall cost?
Undeclared allergens are the first or second most common recall cause in Australia, the US and Canada. Cost data is thinner: the best primary figures are American and several years old, so treat them as a guide, not a UK price list.
- Undeclared allergens are Australia's leading recall cause, with 197 recalls from 2021 to 2025, peaking at 54 (57% of all recalls) in 2024 (FSANZ, Apr 2026).
- Undeclared allergens caused 11 of 34 US meat and poultry recalls in 2024, more than any other reason (USDA FSIS, Dec 2025).
- In 2025, 9 of 42 USDA FSIS recalls were for undeclared allergens, the second most common reason (USDA FSIS, Feb 2026).
- Undeclared allergens were also behind 7 of 24 USDA FSIS public health alerts in 2025, the top reason (USDA FSIS, Feb 2026).
- In Canada, 57 of 185 food recall incidents in 2025/26 were caused by allergens missing from or wrongly identified on the label (CFIA, Aug 2026).
- The EU's Alert and Cooperation Network handled 10,490 food, feed and related notifications in 2025, up 11% on 2024 (European Commission, Jul 2026).
- Labelling defects were the most reported problem for confectionery in the EU network in 2025, at 27% of 339 notifications (European Commission, Jul 2026).
- A significant food and beverage recall claim cost almost US$9.5 million on average in insurer Allianz's analysis of claims from 2012 to mid-2017 (Allianz, Dec 2017).
- The most serious US meat and poultry recalls cut a listed firm's market value by about US$109 million within five days, while lower-risk recalls, often for small amounts of undeclared allergen, had no significant share-price effect (Kansas State University, Feb 2015).
Catching an error before dispatch is cheaper than any of these. Where labels are already on the product, over-labelling can correct them without repacking.
Who relies on food labels being right?
A label matters most to people with a food allergy or intolerance, for whom one missing word can mean a trip to A&E. That group is reacting more often than it did in 2021.
How many people in the UK have a food allergy, intolerance or coeliac disease?
Clinically confirmed allergy is far rarer than self-reported reactions to food. Clinical testing, GP records and self-report all give different answers, so the measures should not be blended.
- More than 30% of adults in the FSA's community survey reported some type of adverse reaction to food, far above the clinically confirmed rate (FSA, May 2024).
- 23% of adults in England, Wales and Northern Ireland say they react badly to, or avoid, certain foods (FSA, Mar 2026).
- 4% of children under five in England had a probable food allergy recorded by their GP in 2018, against 0.7% of adults (Imperial College London, Aug 2024).
- Diagnosed coeliac disease affected about 1 in 278 people in the UK in 2020, almost double the 2010 level, according to a conference abstract (Annals of Family Medicine, Nov 2023).
Are serious allergic reactions to food becoming more common?
Yes. Hospital admissions for food reactions have risen for two decades, and new allergy diagnoses have doubled.
- Hospital admissions in England for other adverse reactions to food reached 4,521 in 2023-24, up from 3,523 a year earlier (NHS England, Jan 2025).
- UK hospital admissions for food-induced anaphylaxis more than tripled between 1998 and 2018, from 1.23 to 4.04 per 100,000 people a year (BMJ, Feb 2021).
- For children under 15, food anaphylaxis admissions rose from 2.1 to 9.2 per 100,000 a year over the same period, the steepest rise of any age group (BMJ, Feb 2021).
- 152 deaths in the UK between 1998 and 2018 were probably caused by food-induced anaphylaxis, although the death rate per admission fell (BMJ, Feb 2021).
- Cow's milk caused 26% (17 of 66) of fatal food anaphylaxis in UK school-age children in data covering 1992 to 2018, the most common single trigger in that group (BMJ, Feb 2021).
- New food allergy diagnoses in England roughly doubled between 2008 and 2018, from about 76 to 160 per 100,000 people a year (Imperial College London, Aug 2024).
Do shoppers check food labels, and do they trust them?
Most trust labels, but many shoppers rarely check allergen information, so a label has to be right for the minority who depend on it.
- 84% of shoppers buying for someone's dietary needs are confident labels let them spot foods that will cause a reaction, down from 90% in 2022/23 (FSA, Mar 2026).
- 86% of adults are confident that the information on food labels is accurate, recovering from a low of 81% in 2024 (FSA, Mar 2026).
- Only 62% of adults correctly identify the use-by date as the date that shows when food is no longer safe, down from 70% in 2021/22 (FSA, Mar 2026).
- In March 2026, 64% of adults in England, Wales and Northern Ireland said they or someone in their household had eaten food past its use-by date in the last month to save money (FSA, Jul 2026).
- In Scotland, 85% of adults always or mostly check use-by dates and 80% check best-before dates when buying food (FSS, Jun 2026).
- Half of Scottish adults (50%) never check allergen information when food shopping, making it the least-checked part of the label (FSS, Jun 2026).
- 48% of Scots with only a food intolerance check allergen information always or most of the time, against 17% of people without a food hypersensitivity (FSS, Jun 2026).
- Selling five fresh produce items loose and removing their best-before dates could cut UK household food waste by about 100,000 tonnes a year (WRAP, Feb 2022).
- 47% of people would throw away milk one day past a use-by date, against 31% if the same milk showed a best-before date (WRAP, Feb 2023).
- 72% of adults living with a food allergy say "may contain" labels hinder their shopping, according to the charity's own survey (Allergy UK, Dec 2023).
Which UK labelling rules are changing?
A food label now answers to several regulators at once, and many policy changes, from Northern Ireland trade to packaging waste, end up on the label. Some of these rules are live; others are scheduled or held in reserve, and we say which.
What new labelling rules do food and drink producers face from 2026 to 2028?
"Not for EU" labels are already live for goods going to Northern Ireland, the deposit return scheme arrives in October 2027, and an EU food trade deal could change the picture again.
- Since 1 July 2025, "Not for EU" labels have been required on goods moving from Great Britain to Northern Ireland retail, including pre-packed fruit and vegetables, fish, eggs, honey, chilled ready meals and pet food, on top of meat and dairy (Defra, Jul 2026).
- The government intends the UK-EU sanitary and phytosanitary agreement to take effect in mid-2027, subject to negotiations, and its call for information drew 489 responses (Defra, Jul 2026).
- From 1 October 2027 the deposit return scheme for England and Northern Ireland covers drinks containers of 150ml to 3 litres in PET, steel or aluminium, and producers must carry scheme labelling unless a product line sells under 5,000 units a year (Defra, Jan 2025).
- About 31.4 billion drinks containers were placed on the UK market in 2022, including 12.1 billion PET bottles and 13.9 billion aluminium cans (Defra, Nov 2024).
- In July 2026 the Codex Alimentarius Commission adopted new international guidelines on "may contain" allergen labelling, saying it should be used only when allergen management is in place and a scientific risk assessment shows a residual risk remains (FAO, Jul 2026).
- Ireland's mandatory alcohol health labels now start on 3 September 2028, pushed back from May 2026, which affects UK producers exporting there (Irish Statute Book, Sep 2025).
- Those Irish labels must show calorie content and grams of alcohol, and warn about drinking in pregnancy, liver disease and fatal cancers (Department of Health (Ireland), May 2023).
- Mandatory menu calorie labelling in England applies only to businesses with 250 or more employees, which the 2020 impact assessment put at about 545 businesses, roughly 0.3% of England's 158,895 accommodation and food service enterprises in 2018 (DHSC, Jan 2020).
How much does a labelling change cost businesses?
Millions across an industry, and thousands per product line. The government's own impact assessments are the best guide to the scale.
- Extending "Not for EU" labelling across Great Britain would cost business between £0 and £38.7 million a year, depending on how many products come into scope (RPC, May 2025).
- If every product in the Northern Ireland scheme had to carry the label in Great Britain, Defra estimates costs of £564.9 million over 10 years; this is a reserve power, not a live rule (Defra, Jun 2025).
- Defra estimates 1,265 food manufacturers with 50 or more staff would need to get to grips with GB-wide "Not for EU" rules if they were switched on (Defra, Jun 2025).
- Defra estimates the packaging extended producer responsibility (EPR) regulations cost businesses a net £1,352 million a year (Defra, Dec 2024).
- Illustrative 2026 to 2027 EPR fees put plastic packaging at £415 to £545 a tonne, with the least recyclable packaging charged 1.2 times the standard rate (PackUK, Dec 2025).
- The Food and Drink Federation says EPR added £1.1 billion in costs to food and drink manufacturers (FDF, Feb 2026).
- The deposit scheme operator's preferred option is no producer fee until December 2028, then an indicative 0.4p per can and 2.43p per PET bottle from 2029; its alternative is a flat 0.3p and 1.88p from October 2027 (Exchange for Change, Jul 2026).
- When Natasha's Law was approved, the government estimated a one-off labelling cost to business of £223.7 million (RPC, Sep 2019).
- HMRC normally calculates Alcohol Duty from the quantity and strength stated on the label or invoice, so the printed ABV feeds directly into the duty bill (HMRC, Aug 2026).
How well do businesses comply, and who checks?
Most businesses say they comply, but the smallest struggle most, and inspection capacity is stretched.
- 64% of food businesses that label prepacked-for-direct-sale food print their labels in-house, 25% use third-party printed labels and 8% still write them by hand (FSA and FSS, Apr 2023).
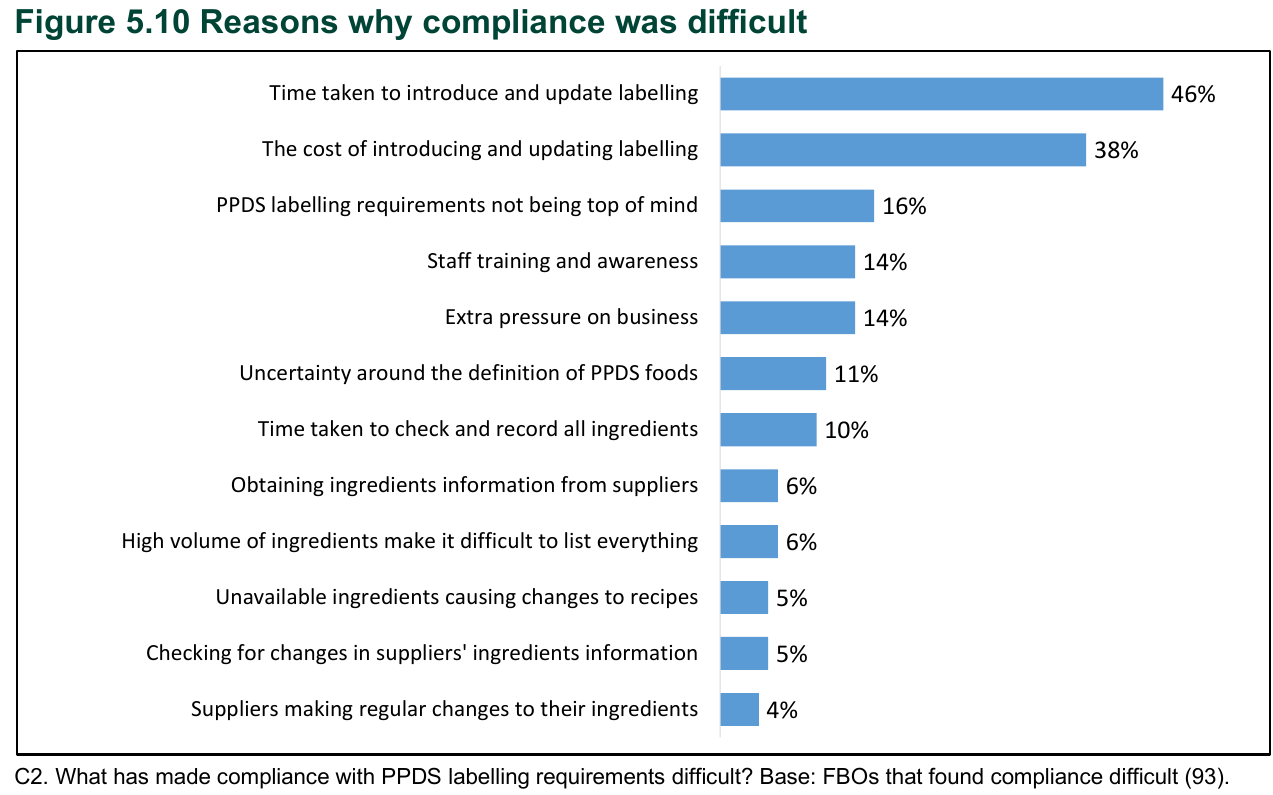
- Of businesses that found Natasha's Law difficult, 46% blamed the time taken to introduce and update labels and 38% the cost (FSA and FSS, Apr 2023).
- Councils in England, Wales and Northern Ireland had 126,804 due food standards interventions outstanding in April 2025, and 58 councils took no food standards samples in 2024/25 (FSA, Sep 2025).
- In a review of 500 alcohol products from top UK brands, 99% carried a pregnancy warning but only 62% showed calorie information (Portman Group, Jun 2026).
- A separate audit of 536 alcohol products found only 6.7% carried any health warning and 28% a full ingredients list (Alcohol Focus Scotland, Jun 2026).
For one-off relabelling projects, such as "Not for EU" or new DRS artwork, a contract labelling service can absorb the peak without new kit or staff.
Is the labour shortage pushing food and drink producers to automate?
Hiring is getting harder and dearer, and most food makers now say they are automating in response. Smaller manufacturers are the most likely to say so.
How hard is it to find and afford staff in food and drink manufacturing?
Hard on both counts. Firms are struggling to fill roles while cutting headcount to control rising wage and tax bills.
- Food and drink manufacturing employed 15,000 fewer people in Q1 2026 than a year earlier, a 3.1% fall against 0.3% across the economy (FDF, Aug 2026).
- 66% of food and drink manufacturers have reduced or plan to reduce headcount because of the April 2025 rise in employer National Insurance (FDF, Nov 2025).
- The National Living Wage rose 4.1% to £12.71 an hour from April 2026 (Low Pay Commission, Nov 2025).
- 17.6% of food processing jobs were paid at or near the minimum wage in 2025, almost three times the 6.6% rate across all jobs (Low Pay Commission, Feb 2026).
- 86% of UK manufacturers expect their employment costs to rise over the next 12 months (Make UK, Jan 2026).
- Labour providers told a government review that candidates per food supply chain vacancy fell from about 6 in 2012 to around 1.6 in 2023 (Defra, Jun 2023).
- Food and drink manufacturing employed about 0.4 million people in Great Britain in 2025 (Defra, Jul 2026).
Are rising labour costs pushing producers to automate?
Yes, in intent at least. About half of manufacturers say rising labour costs have led them to automate, but cost pressures from the Middle East conflict led many to plan to pause or cancel investment in mid-2026, so intent is running ahead of spend.
- In early 2025, 39% of food and drink manufacturers said rising labour costs had led them to increase automation, a lower share than in 2026, though the 2025 survey question was worded slightly differently (FDF, May 2025).
- 54% of food and drink manufacturers said they would focus capital investment on automation in response to higher National Insurance, minimum wage and packaging costs, including 59% of small and mid-sized firms against 20% of large firms (FDF, May 2025).
- 36% of food and drink manufacturers expect to increase automation or labour-saving technology in response to the Employment Rights Act (FDF, Feb 2026).
- Two thirds (66%) of smaller food and drink manufacturers planned to increase spending on plant and machinery in the coming year (FDF, Feb 2026).
- 60% of UK manufacturers plan to invest in digital technologies, AI and automation in the next 12 months (Make UK, Jan 2026).
- 40% of UK manufacturers plan to reskill or redeploy staff because of automation or digital change (Make UK, Jan 2026).
How far behind is the UK on robots, and does automation pay off?
The UK lags its European peers on robots, but most manufacturers say the technology exists, and international research links robot use to faster productivity growth.
- 80% of manufacturing businesses surveyed for the government's food supply chain labour review agreed that automation technology was available for their sector, against 69% in farming (Defra, Jun 2023).
- One in three food supply chain businesses said they had not invested in automation because the technology they needed was not available (Defra, Jun 2023).
- Total factor productivity in UK food and drink manufacturing fell 0.5% in 2024 (Defra, Jun 2026).
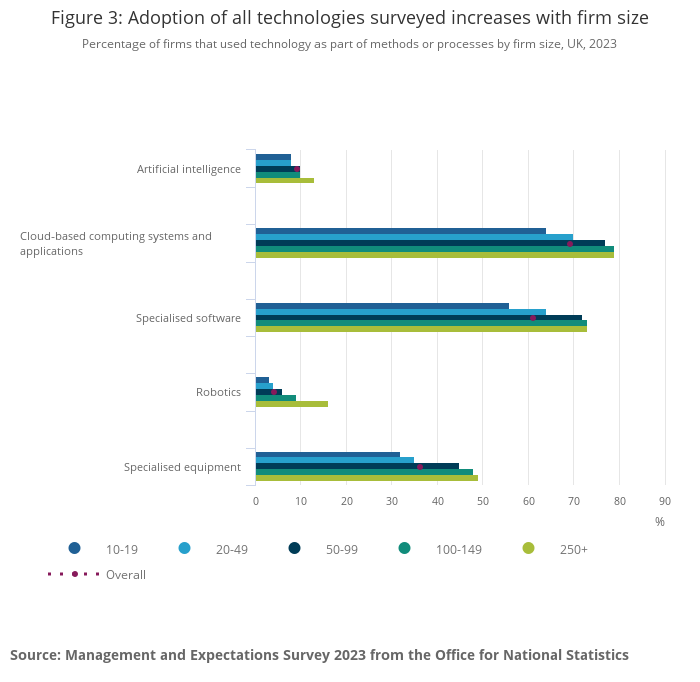
- 14% of UK manufacturing firms used robotics in 2023, against 4% of all firms (ONS, Mar 2025).
- Only 3% of firms with 10 to 19 employees used robotics in 2023, against 16% of firms with 250 or more (ONS, Mar 2025).
- UK industrial robot installations fell 35% to about 2,500 units in 2024, ranking the UK 19th in the world (IFR, Sep 2025).
- The UK food and beverage industry installed 555 industrial robots in 2023, up 59% on the year before (IFR, Sep 2024).
- The UK had 28,831 industrial robots in operation in 2023, while Germany had about nine times as many (IFR, Sep 2024).
- Across 17 countries between 1993 and 2007, wider use of industrial robots added about 0.37 percentage points a year to labour productivity growth without significantly reducing total employment (Review of Economics and Statistics, Dec 2018).
For small producers still labelling by hand, a semi-automatic desktop labeller is often the practical first step to take labelling off the critical path.
Who is doing the labelling?
UK food and drink is a sector of micro-producers with a handful of giant exporters. Both ends have labels to get right, and the small end is under the most pressure.
How many food and drink manufacturers are there, and how small are they?
Tens of thousands, and most are tiny. Counts differ because some sources include unregistered sole traders and others do not.
- UK food and drink manufacturing generated £39.3 billion of gross value added in 2024, 24.2% of the agri-food chain (Defra, Jul 2026).
- Two in three UK food and drink manufacturing businesses (about 16,800) had no employees in 2025, counting unregistered sole traders (Defra, Jul 2026).
- In 2024, 200 new drinks manufacturing businesses started in the UK but 280 closed (ONS, Nov 2025).
- Fewer than half of food and drink manufacturers started in 2019 were still trading five years later: 45.2% of food and 48.2% of drinks businesses (ONS, Nov 2025).
How many breweries, distilleries, vineyards and cider makers does the UK have?
Brewery numbers are falling while distilleries and vineyards have grown, and each has to get its labels right.
- The UK had 1,578 breweries on 1 January 2026 after a net loss of 137 during 2025, almost three a week (SIBA, Jan 2026).
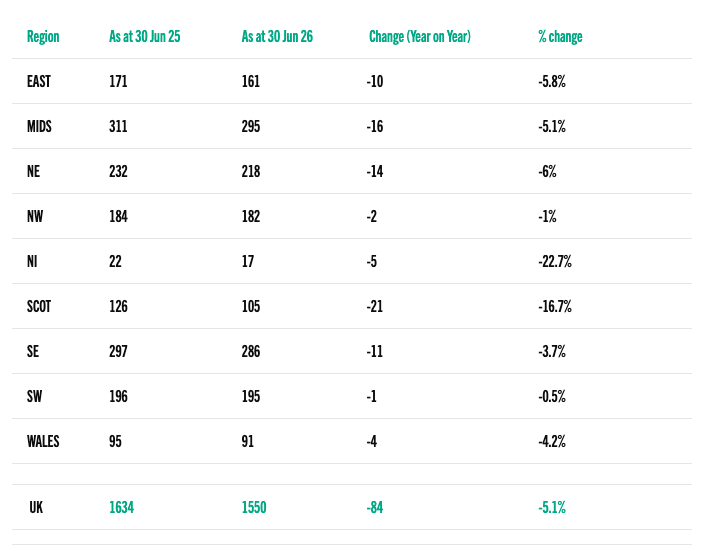
- Closures slowed in the first half of 2026: SIBA's revised count fell by a net 16, from 1,566 at the end of 2025 to 1,550 at 30 June (SIBA, Aug 2026).
- Over the year to June 2026, Scotland's brewery count fell 16.7%, from 126 to 105 (SIBA, Aug 2026).
- There are 156 operating Scotch whisky distilleries in Scotland (Scotch Whisky Association, Sep 2026).
- 426 distilleries were registered in the UK in 2024 according to HMRC data, up from 116 in 2010 (WSTA, Jul 2025).
- UK vineyards produced 124,377 hectolitres of wine in 2025, about 16.6 million bottles and 55% more than in 2024, according to FSA production declarations (FSA, Mar 2026).
- 1,158 vineyards were registered with the FSA in 2025, 779 of them commercial (FSA, Mar 2026).
- The National Association of Cider Makers estimates there are 450 cider makers in the UK, a figure cited by Defra in Parliament (UK Parliament, Dec 2025).
- The number of VAT or PAYE registered drinks manufacturers fell 3.5% in the year to March 2026, from 2,695 to 2,600 (ONS, Sep 2026).
How much does the sector produce and export?
Billions of labelled units a year, from a sector that is exporting record values but lower volumes.
- Scotch whisky exports were worth £5.3 billion in 2025, down 1.8% in value and 4.3% in volume on 2024 (Scotch Whisky Association, Feb 2026).
- Scotland shipped the equivalent of 1.34 billion 70cl bottles of Scotch in 2025, about 43 bottles every second (Scotch Whisky Association, Feb 2026).
- Scotch whisky made up 21% of all UK food and drink exports in 2025 (Scotch Whisky Association, Sep 2026).
- The UK exported the equivalent of more than 185 million bottles of gin in 2024, worth over £500 million (WSTA, Jul 2025).
- The UK soft drinks market sold 16,131 million litres in 2025, worth a record £26.3 billion, according to GlobalData figures in the BSDA's report (BSDA, Jul 2026).
- 71.4% of soft drinks sold in the UK in 2025 were low or no calorie, a new high (BSDA, Jul 2026).
- UK food and drink exports reached a record £25.6 billion in 2025, but food export volumes were still 27% below 2019 (FDF, Mar 2026).
- UK food and drink export volumes fell 11.7% in the first half of 2026, the third lowest level on record (FDF, Sep 2026).
- Only 34% of global consumer packaged goods launches in 2025 were genuinely new products, down from 47% in 2015 (Mintel, Mar 2026).
How healthy is the label industry?
The label supply chain has climbed out of its 2023 slump but not back to where it was. Many of the converters who print labels see automation as their most critical success factor.
Is label demand growing again in the UK and Europe?
Slowly. Europe-wide volumes are recovering, but FINAT's figures are not UK-specific and UK print output dipped sharply in 2026.
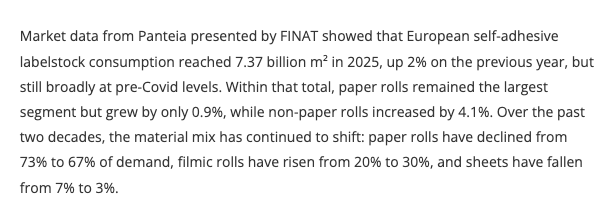
- European self-adhesive labelstock consumption reached 7.37 billion square metres in 2025, up 2% on 2024 (FINAT, Jun 2026).
- European labelstock demand fell 25% in 2023, then recovered by 15% in 2024 (FINAT, Feb 2025).
- Despite that rebound, European label volumes in 2024 were only back at 2016 levels (FINAT, Dec 2025).
- The five biggest European label markets, including the UK, used 60% of Europe's labels in 2024, but all except Spain were using fewer than in 2021 (FINAT, Jun 2025).
- 72% of 71 European label converters surveyed were not seeing a decline in consumer demand in early 2025 (FINAT, Jul 2025).
- 42% of UK printers in the BPIF's Printing Outlook survey reported lower output in Q2 2026, giving an output balance of minus 21, the most negative in six years (BPIF, Aug 2026).
- Only months earlier, in Q4 2025, UK print output was strong, with a balance of plus 35 (BPIF, Feb 2026).
How much do UK manufacturers sell in labels, and how are the big label makers doing?
UK label sales are recovering but remain below their 2021 peak, while the global material suppliers reported a strong first half of 2026.
- UK sales of printed self-adhesive paper labels in 2025 were still about 10% below their 2021 peak of £911.7 million, before allowing for inflation (ONS, Jul 2026).
- Across all paper and paperboard label types, UK manufacturers' sales totalled about £908.5 million in 2025 (ONS, Jul 2026).
- Avery Dennison's Materials Group, which makes pressure-sensitive label materials, had 2025 sales of US$6.09 billion, down 0.7% on an organic basis (Avery Dennison, Feb 2026).
- In Q2 2026, Avery Dennison's Materials Group sales rose 15.9% to US$1.8 billion (Avery Dennison, Jul 2026).
- CCL Industries' label segment posted 2025 sales of C$4.88 billion with 4.9% organic growth (CCL Industries, Feb 2026).
- CCL's label sales rose 9.0% to C$1.34 billion in Q2 2026, with only low-single-digit organic growth in Europe (CCL Industries, Aug 2026).
- UPM Adhesive Materials, formerly UPM Raflatac, had Q2 2026 sales of EUR 448 million, up from EUR 425 million a year earlier (UPM, Jul 2026).
- UPM described European self-adhesive label material markets as good in Q2 2026, against weak markets in North America (UPM, Jul 2026).
How are label makers responding to costs, automation and sustainability?
Many converters see automation as critical, and film is taking share from paper.
- Over two decades, film-based label rolls grew from 20% to 30% of European labelstock demand (FINAT, Jun 2026).
- In preliminary FINAT RADAR and AWA research, 40% of European label converters named digitalisation and automation as their most critical success factor for the next three years (FINAT, Jun 2026).
- 62% of UK printers in the same BPIF survey reported higher paper prices in Q2 2026, and labour remained their biggest cost at 34% of the total (BPIF, Aug 2026).
- OPRL, the UK's on-pack recycling label scheme, had more than 980 member organisations by the end of 2025 (OPRL, Jan 2026).
- OPRL members ran more than 5,200 packaging recyclability assessments in 2025 (OPRL, Jan 2026).
Methodology
We cite the organisation that produced each figure wherever possible: regulators, government departments, official statistics, peer-reviewed research, company filings, and trade bodies where they ran the survey or tracker themselves. We do not cite statistics roundups or news coverage of other people's data. Every link was opened and the figure confirmed on the page before publication. FSA incident and sampling figures cover England, Wales and Northern Ireland; Scotland is covered by Food Standards Scotland. Where a source changed its method (such as the FSA's May 2025 incident recording system) or where sample sizes are small or undisclosed, we say so next to the figure. Older studies are included only where they remain the most authoritative evidence available, and are dated so you can judge them. The FSA's 2025 wine production release has been removed from its live site, so those figures link to the copy held in the UK Government Web Archive, as does the FSA's 2024 food allergy news release. A few figures come from a trade body or Parliament reporting another organisation's data; the bullet names the original producer. We review and refresh this page monthly.
Glossary
- ABV: alcohol by volume, the strength printed on a drinks label.
- Converter: a company that prints and finishes labels from labelstock.
- DRS: deposit return scheme for drinks containers, starting in England and Northern Ireland in October 2027.
- EPR: extended producer responsibility, which makes packaging producers pay for the waste their packaging creates.
- FINAT: the European association for the self-adhesive label industry.
- FSA / FSS: Food Standards Agency (England, Wales, Northern Ireland) and Food Standards Scotland.
- IgE-mediated allergy: the immune reaction behind most severe and sudden food allergies.
- Labelstock: the self-adhesive material (face material, adhesive and liner) that labels are printed on.
- NIRMS: Northern Ireland Retail Movement Scheme, which requires "Not for EU" labels on certain goods.
- NLW: National Living Wage.
- OGL: Open Government Licence, which allows reuse of UK government data with attribution.
- PAL: precautionary allergen labelling, the "may contain" statements on packs.
- PPDS: prepacked for direct sale, food packed on the premises where it is sold, covered by Natasha's Law.
- Prodcom: the ONS survey of UK manufacturers' sales by product.
- SKU: stock keeping unit, a single product line or variant.
- SME: small or medium-sized enterprise, usually fewer than 250 employees.
- SPS agreement: the planned UK-EU sanitary and phytosanitary (food and farming) agreement.
Sources
- FSA, Incidents and Resilience Annual Report 2025/26
- FSA, Annual Report of Incidents, Resilience and Prevention 2024/25
- FSA, Retail Surveillance Survey Sampling Programme 2025-26
- FSS, Annual targeted food sampling programme 2024-25
- Food Control, Food allergen recalls in the United Kingdom 2016 to 2021 (Yue et al.)
- FSANZ, Food recall statistics
- USDA FSIS, Summary of Recall and PHA Cases 2024
- USDA FSIS, Summary of Recall and PHA Cases 2025
- CFIA, Food safety recalls, investigations and complaints statistics
- European Commission, Alert and Cooperation Network 2025 Annual Report
- Allianz, Product recall risks growing in size and number
- Kansas State University, Costs of Meat and Poultry Recalls to Food Firms
- FSA, Patterns and Prevalence of Adult Food Allergy
- FSA, Around 6% of the UK adult population have a food allergy (UK Government Web Archive)
- FSA, Food and You 2: Wave 11 key findings
- FSA, Food and You 2: Wave 11 trends report
- FSA, Consumer Insights Tracker end of year report 2025 to 2026
- FSS, Food and You 2 Scotland Wave 11 key findings
- NHS England, Hospital admissions for allergies and anaphylactic shock
- BMJ, Food anaphylaxis in the United Kingdom 1998-2018 (Baseggio Conrado et al.)
- Imperial College London, Food allergy doubles in the UK over last decade
- Annals of Family Medicine, Incidence and prevalence of coeliac disease in the UK
- WRAP, Reducing household food waste and plastic packaging
- WRAP, Citizen insights on Use By and Best Before dates on dairy products
- Allergy UK, Decoding food allergy labelling
- Defra, "Not for EU" labelling requirements under NIRMS
- RPC, Opinion on the Marking of Retail Goods Regulations 2025
- Defra, Marking of Retail Goods Regulations 2025 Impact Assessment
- Defra, SPS agreement: preparing your business
- Defra, Explanatory Memorandum to the Packaging EPR Regulations 2024
- PackUK, Year 2 illustrative waste disposal fees
- PackUK, Operational plan 2026 to 2027
- FDF, State of Industry Report Q4 2025
- Defra, Deposit return scheme: drinks producer and retailer responsibilities
- Defra, Deposit Return Scheme Impact Assessment
- Exchange for Change, Consultation on Producer Fees
- RPC, Opinion on allergen provisions for food prepacked for direct sale
- FSA and FSS, Evaluation of PPDS Allergen Labelling Requirements
- FAO, Codex adopts guidance on "may contain" allergen labels
- FSA, Annual Local Authority Performance 2025
- Irish Statute Book, Public Health (Alcohol) Act 2018 commencement
- Department of Health (Ireland), Health labelling of alcohol products
- Portman Group, 2026 UK Market Review
- Alcohol Focus Scotland, A Clear Way Forward
- DHSC, Calorie labelling impact assessment
- HMRC, Alcoholic products technical guide: duty liability
- FDF, State of Industry Report Q2 2026
- FDF, State of Industry Report Q1 2026
- FDF, State of Industry Report Q1 2025
- FDF, State of Industry Report Q3 2025
- Low Pay Commission, LPC recommendations take the National Living Wage to £12.71
- Low Pay Commission, National Minimum Wage Report 2025
- Make UK, Executive Survey 2026
- Defra, Independent Review into Labour Shortages in the Food Supply Chain
- Defra, Food statistics in your pocket
- Defra, Total Factor Productivity of the UK Food Chain 2024
- ONS, Management practices and the adoption of technology and AI in UK firms: 2023
- IFR, World Robotics 2025 press release
- IFR, World Robotics 2024 UK press release
- Review of Economics and Statistics, Robots at Work (Graetz and Michaels)
- SIBA, Brewery Tracker January 2026
- SIBA, Brewery Tracker August 2026
- Scotch Whisky Association, Facts and Figures
- Scotch Whisky Association, 2025 export figures
- WSTA, The UK Wine and Spirit Trade In Focus
- FSA, UK wine production soars in 2025 (UK Government Web Archive)
- UK Parliament, Written question 98890 on cider makers
- BSDA, Industry Insights 2026
- ONS, UK business: activity, size and location
- ONS, Business demography, UK
- FDF, Food and drink export values reach record high in 2025
- FDF, Food and drink exports drop to third lowest levels on record
- Mintel, Most Innovative 2026
- FINAT, European Label Forum 2026
- FINAT, The European label industry's 2025 outlook
- FINAT, Labels of the Future
- FINAT, European Label Forum 2025 full report
- FINAT, RADAR 28
- ONS, UK manufacturers' sales by product (Prodcom)
- BPIF, Printing Outlook Q3 2026
- BPIF, Printing Outlook Q1 2026
- Avery Dennison, Q4 and Full Year 2025 Results
- Avery Dennison, Q2 2026 Results
- CCL Industries, 2025 Fourth Quarter and Annual Results
- CCL Industries, 2026 Second Quarter Results
- UPM, Half Year Financial Report 2026
- OPRL, A Look Back at 2025